Bike Rental System, Part II, EDA
Exploratory Data Analysis
Exploratory Data Analysis (EDA)
We have two datasets named bikeshare and divvtbikes. In the following, we will examine these two.
Here we have some statical reports on a dataset.
Data visualization
trips per hour in a month:

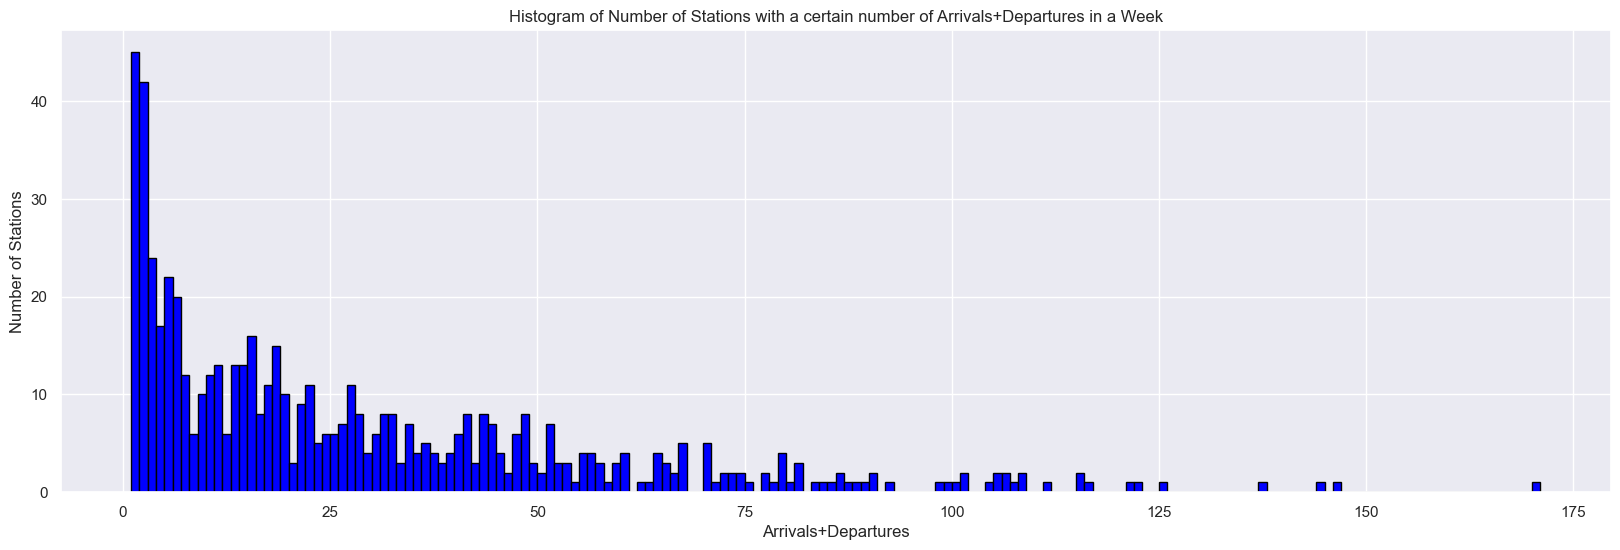
Histogram of Number of Stations with a certain number of Arrivals+Departures in a Week:

- The histogram provides a concise representation of the distribution of bike stations, categorized by the quantity of arrivals and departures within a week. The analysis reveals that the majority of bike stations exhibit limited engagement, with comparatively fewer incoming and outgoing journeys. Conversely, only a minor portion of stations encounter notably elevated trip figures.
Trends + analysis
We also analyze patterns in the monthly, weekly, and daily periods of dataset to extract valuable information.
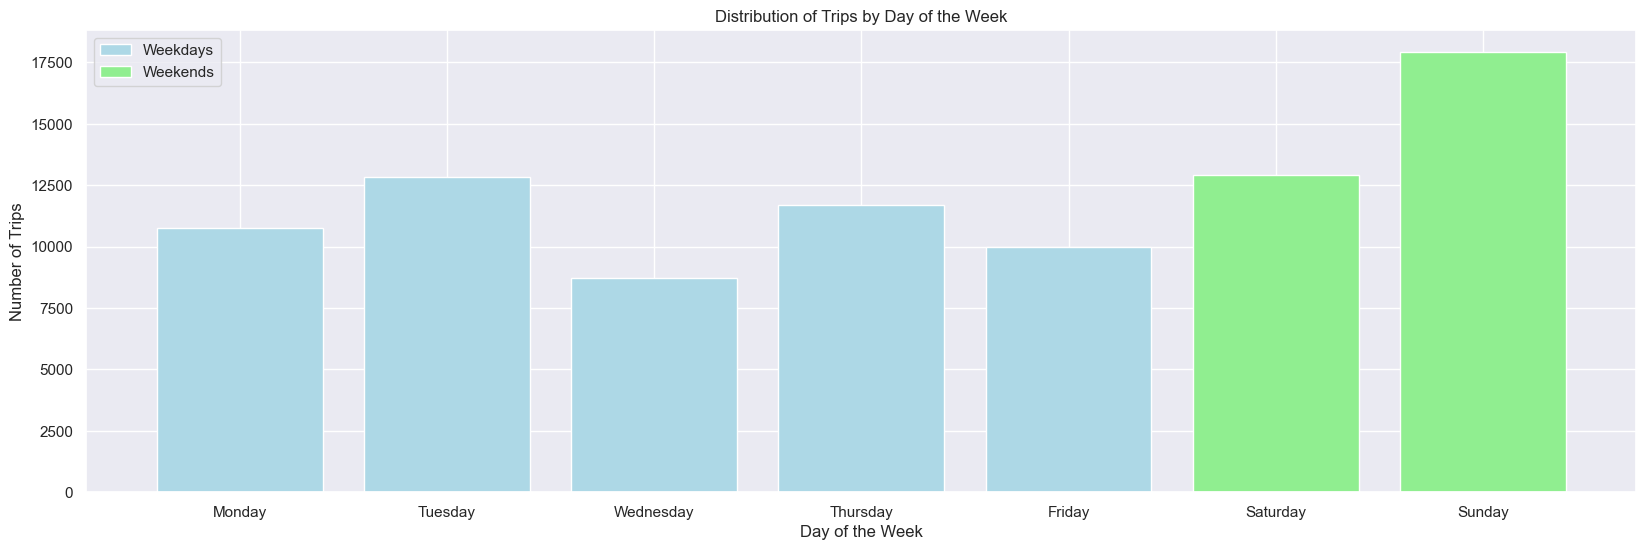
weekly

- The bar plot provides an efficient visualization of the distribution of bike trips based on the day of the week over a three-month period. The data analysis uncovers clear patterns in bike-sharing demand, with higher usage during weekends (Saturday and Sunday) and Tuesday, and moderate demand on weekdays (Monday, Thursday, and Friday). This information can be valuable for bike-sharing operators to plan for the distribution of stations across the service area.
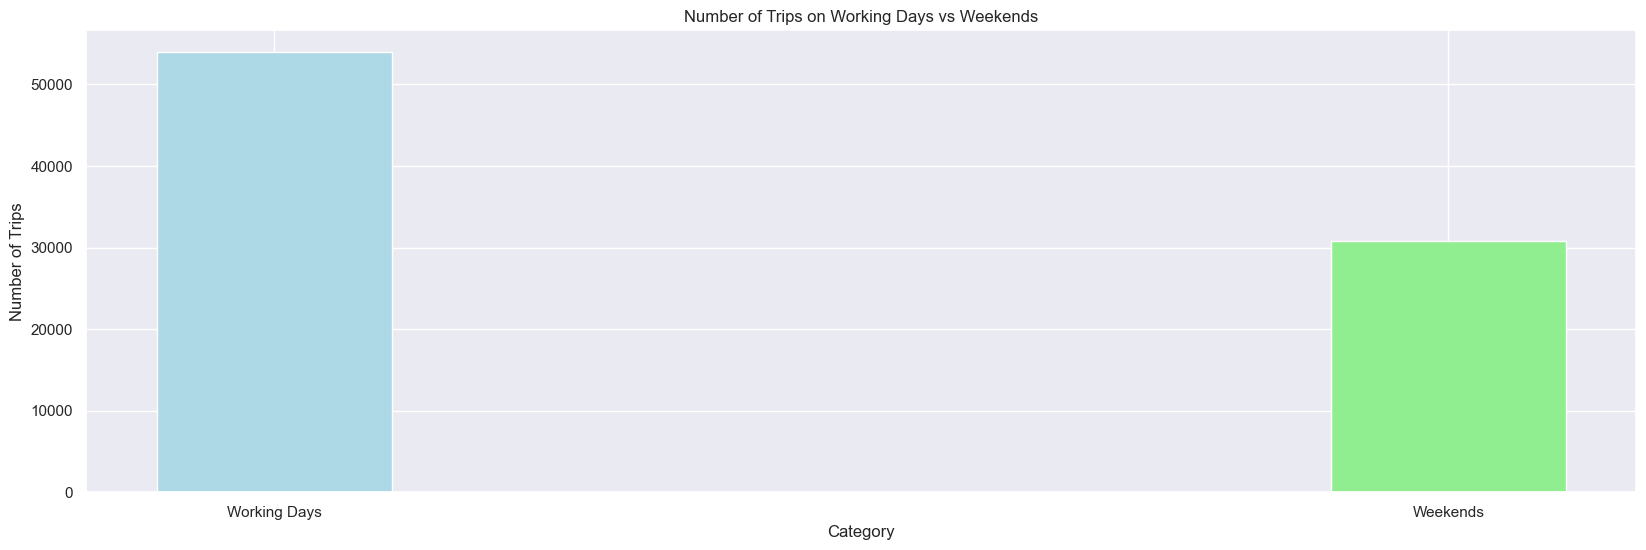
working days vs weekend

- The bar plot provides a clear visualization of the disparity in bike-sharing demand between working days and weekends. The analysis reveals that bike trips are significantly more frequent and widespread on working days, primarily driven by higher commuting and daily transportation needs. In contrast, bike-sharing experiences a decrease in usage during weekends, as individuals engage in recreational activities and have reduced work commitments.
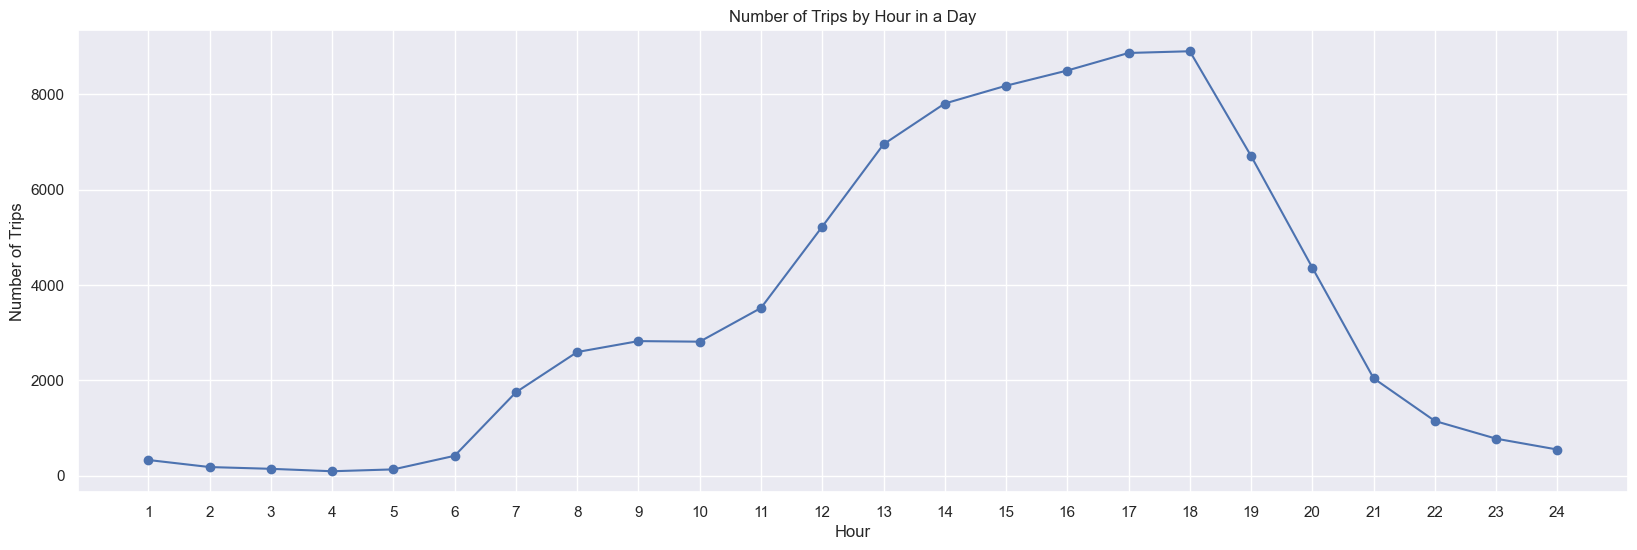
daily

- The line plot provides an effective visualization of the temporal distribution of bike trips throughout the day. The data analysis uncovers distinctive trends in bike-sharing demand during different hours, with significant peaks observed during the morning and evening rush hours. This information can be valuable for bike-sharing operators to plan for the distribution of bikes and stations across the service area.